

If you are a non-technical business user / project manager in an AI / Data Science project, you probably feel a bit overwhelmed with all the technical terms thrown at you. Some examples of things you may have seen being juggled during a data science discussion: correlation, causality, regression, classification, neural networks, decision trees, among others.
If you've participated in a data science project before, you probably heard someone interchanging between these terms when making decisions about which algorithms to use, which data to include and how to embed model results into the users.
And why is it important that you, as a project sponsor / business user, are aware of certain data science concepts?
Although not mandatory, this will surely help you understand the impact of every decision done throughout the project and have confidence in every detail of what's been built. Additionally, in the past, you could have felt that you wanted to contribute a bit more to certain decisions throughout the project and we want to help on that (it is even stated in our vision!).
In the "DS Building Blocks" series, we aim to demistify some data science concepts that you, as a business user, may have stumbled upon in the past - either in a meeting, a conference or as an active part of a data science project.
Our goal is to break this down and make you comfortable when using these terms (and also find snake oil sellers!).
In this post, we want to detail the difference between classification and regression algorithms - mainly this point will have a lot of influence on:
- The project success metric.
- The output of the model(s)
After reading this post, you should be able to contribute with your ideas regarding this topic in your next data initiatives. Let's start!
Why does it matter and what are the main differences?
If you have a project that wants to predict something, you will normally (ignoring other solutions, for simplicity) use a regression or a classification algorithm. These two types of algorithms are supervised learning solution (we will have a post about this in the future!) and have a major difference that is explained in a single sentence:
Classification algorithms predict a discrete label while regression predicts a continuous label
Wait! Don't leave so early. Let's break this jargon down:
- "Classification algorithms predict a discrete label" - We want to predict something that we can fit into specific classes. For instance, if we want to predict customer churn, we can only fit the customer into two categories: Churning or Not Churning. There's no half churning or semi-churnin meaning there are no infinitesimal values between the customer churning or not churning. Everything that only fits a certain amount of categories will, probably, be solved using a classification algorithm.
- "Regression predicts a continuous label" - Here, we want to predict a continuous variable. The price of a house, for instance. Can you count the classes you can fit "house prices" into? Nope! Well.. you can, but you would have a gazillion categories to manage, such as houses that cost 100000.1, 100000.2, 100000.3 dollars, and so on. The fact that our goal is to predict a variable that contains infinitesimal continuous values makes it a fit for a regression algorithm.
Under the hood, you will optimize for different stuff. It's the same as if you are building a boat or a car. Both are vehicles, both are powered by some source of energy but they must be optimized for different things. One rides on the water and the other rides on the road. What happens when you try to optimize a car to ride on the water? Well.. I think you can imagine.
Glimpsing into Classification
Starting with a small example. Let's imagine that we want to understand which customers will Churn (no longer buy something from you) and we have the following 2-D plot:
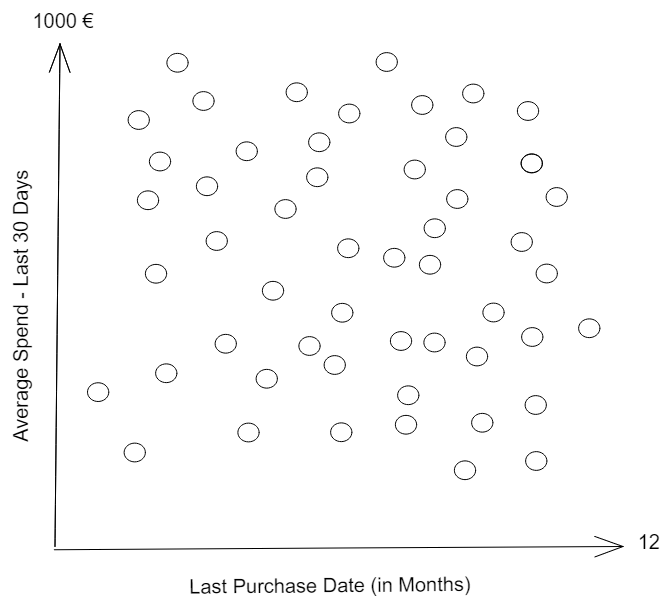
Each customer is a dot. We have customers plotted according to the last time they purchased from your company and their average spending in the last 30 days they were active. Let's imagine that we wait 3 months and checked which customers churned:
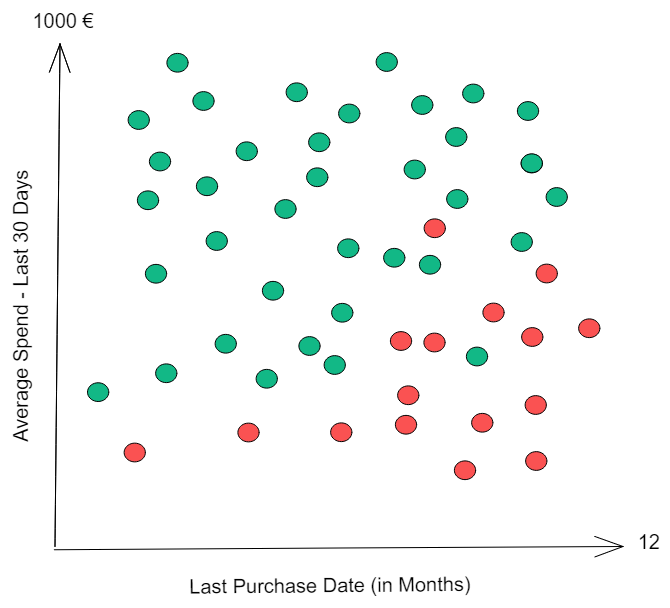
Green dots were examples of customers that did not churn. Red ones were the ones that did.
We clearly notice that dormant customers with low spend will likely churn in in the next 3 months. If we want to build a machine learning model, what would we like to do? Ideally, we would like to separate the classes perfectly.
Basically, we want to predict the probability of a customer belonging to each of these 2 classes, where the probability sum between the two is equal to 100%. Seems obvious, but we if our model dictates that the customer has a 20% chance of churning, then it has an 80% chance of not churning - this is the main reasoning behind classification algorithms, fitting "entities" into closed scenarios.
Let's do a thought experiment. Can you draw a single line that for each y only has a single x (meaning, without raising your imaginary pencil) that separates the two classes perfectly?
Let's see:
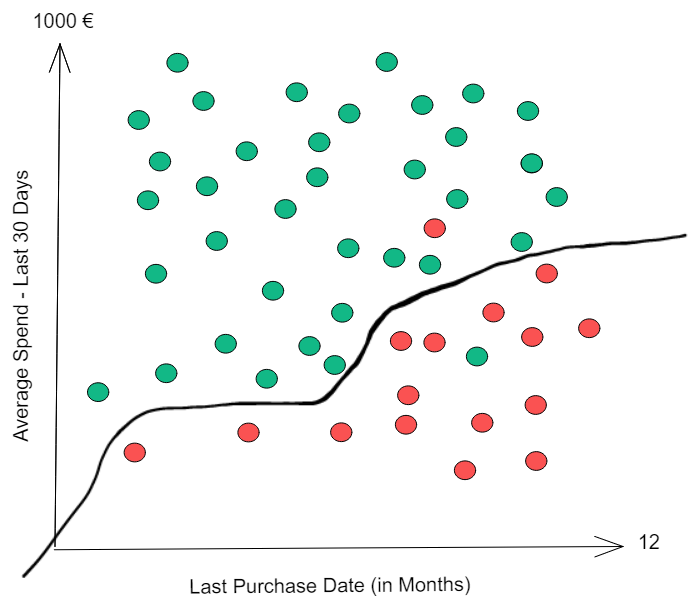
We've just created our first algorithm! If we assume that everything above the line doesn't churn and everything below the line will, we only have two misclassified examples - a value of around 96% accuracy. This algorithm is pretty good! What happens when a new customer behavior is analyzed?
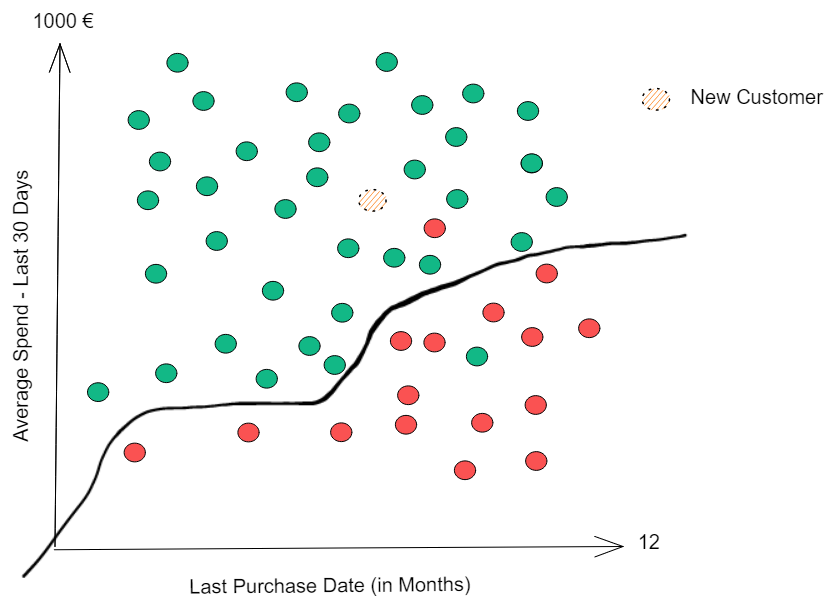
If you had to guess, which class would you think our customer would belong to? Churn or No Churn? Obviously, No Churn!
Bottom line - why is this a classification problem? We are solving a problem where we want to fit our entities into a set of specific classes. What other real life examples can fit this description? Let's see:
- If a person is going to default or not.
- If someone is going to claim their insurance or not.
But there's more! We only spoke of binary classification problems, where we have two classes. But classification problems are also prone to deal with multiple classes:
- If a certain piece from a factory is classified as a small defect, large defect or no defect.
- If a image is an image from a cat, a dog or a bird.
These classification problems tend to output a value related to a "probability" (depending on the algorithm used, the output value from the model may only be a proxy for probability).
As a recap, how can you identify a classification problem?.
- The entity you are modelling belongs to a single class, being mutually exclusive.
- The probability of the outcomes sum up to 100%.
Leaning into Regression
Regression is a different type of problem to solve.
It is deeply tied with continuous variables. Meaning that you want to predict a continuous value - for instance, the price of a house.
Let's imagine the following plot of house prices vs. square foot:
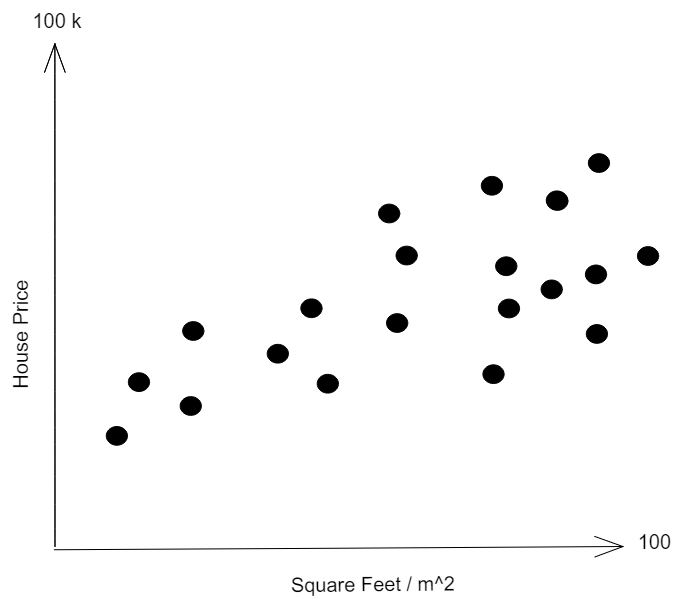
Here, there is no single class that you want to predict - you want to estimate what is the average house price of a house given its square foot. Of course you could split the house prices above or below a certain threshold such as:
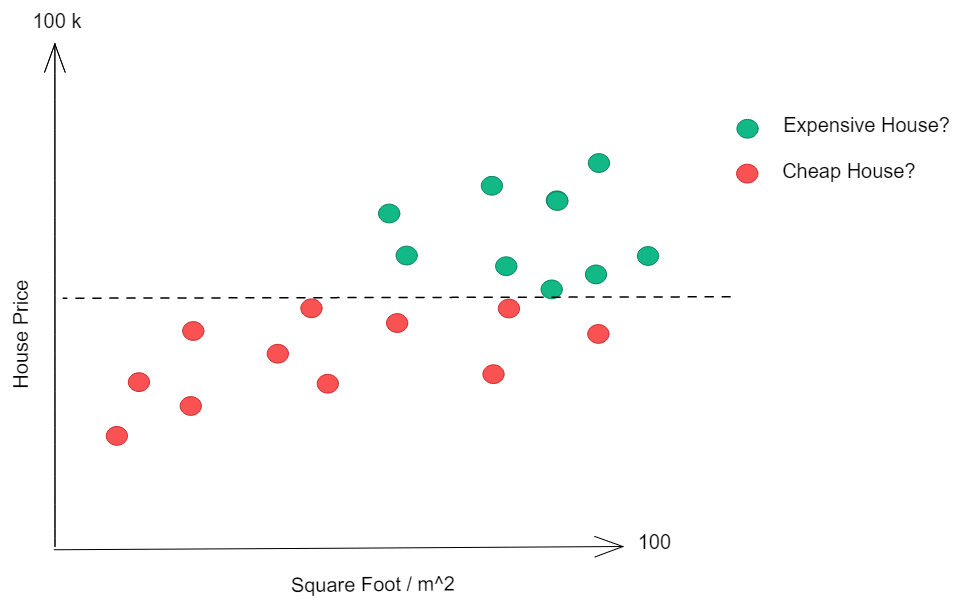
But.. does it bring value to understand if a house value will be above a certain threshold? Does it make sense to consider a house that costs 60k in the same group as a house that costs 100k?
Probably, no!
We would like to predict, on average, what would be the house price as we move on square foot - drawing a line like this:
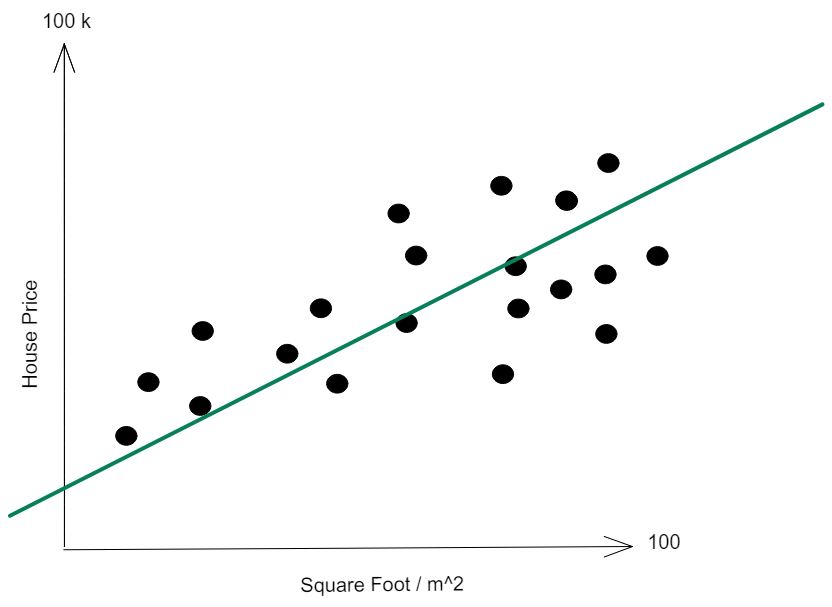
There is no single class that you want to predict - and your algorithm can output a million (even more than that) numbers - your algorithm is now able to predict values such as 13569.1 €, 105484.2 €, 100000.0001 €, 15453,15 €, 1586659, 12 €, among all other infinitesimal possibilities.
With my regression line calculated, as soon as a new house shows up, I can predict it's price using my equation:
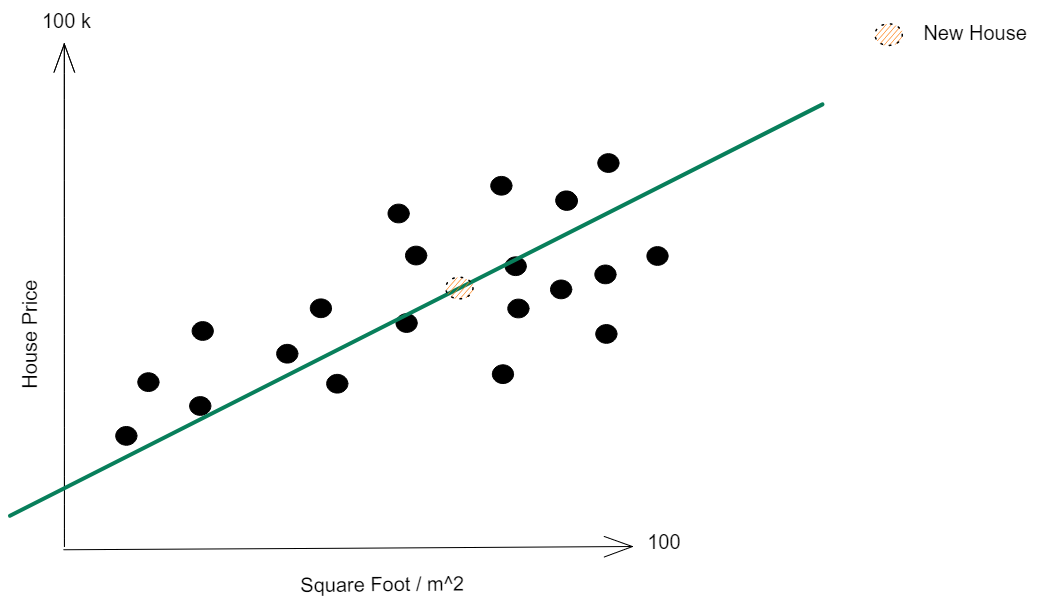
For this 60 square foot house - what price would you predict? Probably around 50k euros as this is the value where our new house (with real unknown price!) falls on our equation - it's what we call our best guess based on our model.
This line is called a Regression model - a model with a continuous target at its core.
Different Problems, Different Metrics
Other than optimizing for different things, classification and regression are also evaluated with different metrics.
For classification, your metrics are normally tied with a probability output or a value related to how well your model discriminates the classes. Accuracy, confusion matrices, Precision - these can only be used for classification algorithms. Let's visualize our churn problem again:
If we consider everything above the line as customers that will not churn and everything below as customers that will, our confusion matrix is:
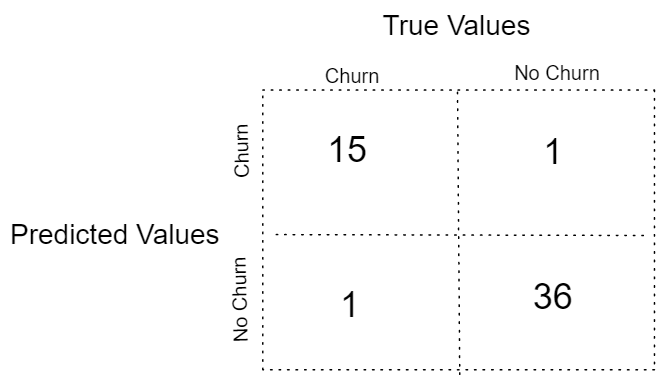
What's our algorithm accuracy? We just sum the main diagonal and divide it by the sum of the entire matrix to find the error! 2/(15+1+1+36) which will be 3.77%. Subtracting this value from 100% and we have our accuracy, 96.23%!
Could we extract this confusion matrix and accuracy for regression? How do we fill the matrix if there are no classes to classify? Checking our house price example:
With regression, you can't use metrics based on the confusion matrix (including accuracy!) as there is no way for you to fill it. So, how can we evaluate our regression models and assess their performance?
Mostly, error metrics are tied to a simple concept - the difference between the line we've created and the real house prices! Using just a couple of points to exemplify:
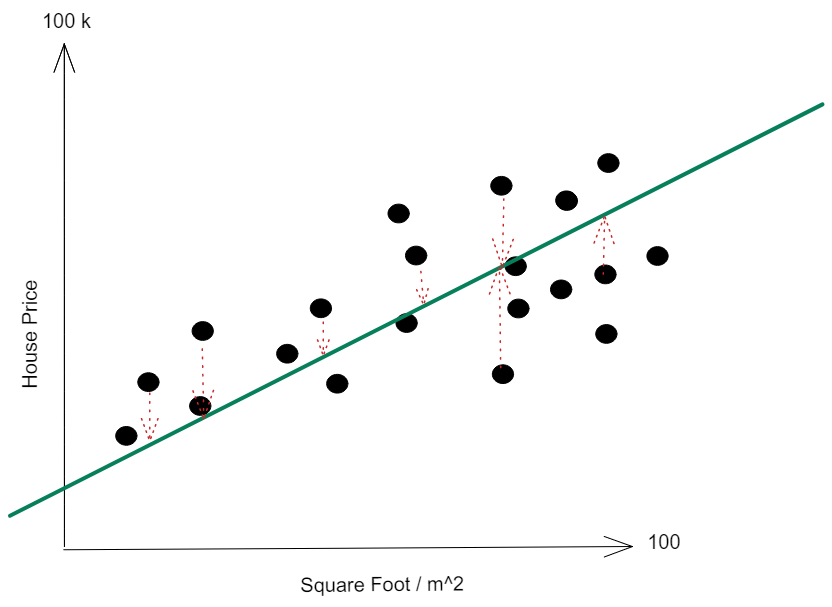
The difference between the points and our line (remember that this is the line we will be using to predict new house prices!) will originate a lot of metrics regarding regression - some of them are the Mean Absolute Error, Mean Squared Error or Root Mean Squared Error. Don't need to know them - just know that they are completely different metrics from what one calls the "accuracy".
Can you name them?
Litmus test time! Let's see if I was able to pass these concepts correctly. Can you name if the following problems are classification or regression? Answers are at the end of the post!
- Predicting how much a Customer will spend during the next 4 months.
- Predicting if a transaction is Fraudulent or Not.
- (tricky one!) Predicting the number of people that will survive a boat crash.
- (tricky one!) Predicting if a specific person will survive a boat crash.
- Predicting the number of months that will pass before a user uninstall an app.
- Predicting the number of books someone has in its library.
- Predicting if a user is going to uninstall an app or not.
Hope you got everything correctly!
Conclusion
When you first start to address them, these concepts seem a bit cumbersome to grasp. They are definitely not first nature to everyone, particularly if you don't have a statistics background. But, probably, there will be a ton of opportunities where you will identify these principles and how they can be applied in your daily life.
In the future, we will also approach other DS building blocks, such as:
- Supervised vs. Unsupervised learning;
- Basic statistics and what do they mean;
- Data distributions;
- Different models;
If you have any feedback or you are interested in discussing some of these topics, feel free to drop me a message at ivo@daredata.engineering or via LinkedIn.
Thank you for taking the time to read this post and I hope you found it enjoyable - contact us via our website to know more about our services or just a chat about Data Science/Engineering topics!
Oh, and most importantly, here are the answers for the challenge!
- Regression
- Classification
- Regression
- Classification
- Regression
- Regression
- Classification