

DISCLAIMER
We are not economists. We are not epidemiologists. This is not an academic paper and has not gone through a peer review process. All core assumptions that are related to each of these fields are taken from experts. As a pandemic in modern times is a unique event, it is not possible to model resulting economic events with any degree of certainty. The best we can likely hope for is to get within an order of magnitude.
Any examples provided in this paper are NOT to be taken as ready for use in any particular use case. If you want to use the model, you need to do the hard work of selecting your parameters.
Why we use an updatable heuristic model and why you should too
This post will guide you through an example on how we’ve been assessing the impact of the COVID-19 pandemic on sales - and specifically why businesses should be using an updatable model on their recovery analysis.
At the end of the article you should be able to understand why it is almost mandatory to have a model that is updated swiftly to incorporate new information that contains assumptions like the ones we have never seen before. From business personalities (https://www.gatesnotes.com/Health/Pandemic-Innovation), to investors (https://www.berkshirehathaway.com/qtrly/1stqtr20.pdf) and health officials (https://www.who.int/news-room/detail/03-04-2020-who-and-unicef-to-partner-on-pandemic-response-through-covid-19-solidarity-response-fund) everyone seems to agree on the unprecedented consequences of this crisis. So, should we use a mathematical model based on past data to correctly predict sales for the months to come? The datasets we have seen seem to strongly indicate that that will be an unlikely hypothesis. Let’s see why!
Model Update - Restaurant Use Case
During our previous couple of posts (check them here: https://blog.daredata.engineering/tag/covid-19/), we have shown how we are approaching the adjustment of forecasting models during these extraordinary times. Most countries in Europe are now finishing their first lockdown period and are approaching a recovery phase since most businesses are through one of the worst phases they should expect in terms of sales. One of our customers, a Portuguese restaurant, gave us some data and proposed us a challenge - “Can you study some scenarios for my sales based on the economic recovery and incorporate the changes I’ve done in my business?”
Apart from giving us the data, the restaurant also gave us some bits of important information:
- The business owner used all the means in his power to adapt the business during the lockdown periods - he did some internet marketing and changed some of his business to take-away;
- He expected to maintain the same behavior until he could open his doors;
- After opening the doors he still wanted to keep doing some take-away sales.
Every piece of information like this will help a lot on our scenario analysis. Let’s see how we proceeded to give the restaurant owner an adjustment of his sales. We’ll do the following:
- Visualizing the data;
- Fit a first forecast model based on a standard scenario based on a few parameters (described here: https://docs.google.com/document/d/1cD82e4LuWe0lUrHlFCy9GBYMcJesbVRGy9zBlU9r0wM/edit);
- Make some adjustments based on new information provided by the business owner;
Visualizing the Data
Looking at the data, you can clearly witness the impact that the coronavirus pandemic had on the restaurant daily revenue since the beginning of the lockdown period (Lockdown in Portugal begun on the 18th of March 2020):
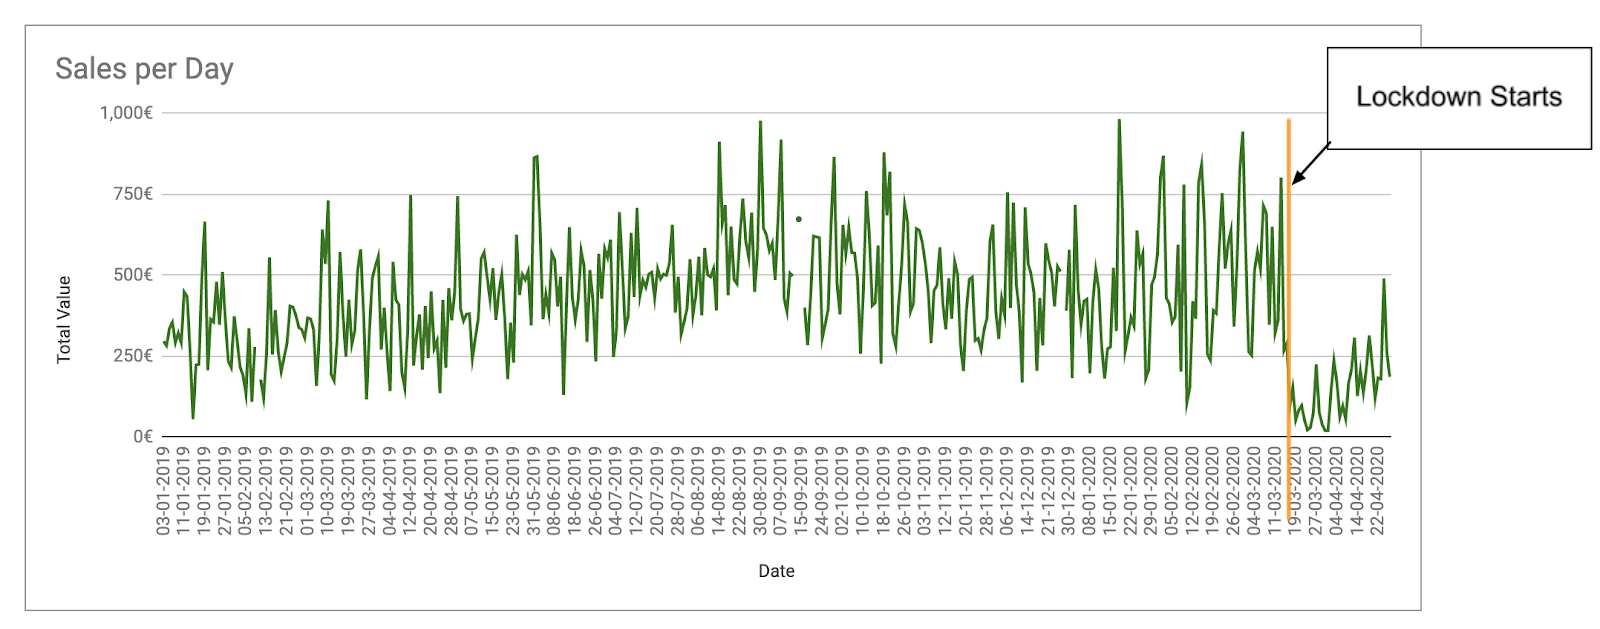
There was a huge bump at the start of the lockdown, throwing the company's revenue to about 20% of the value in the prior week. This was approximately the dropdown rate we were expecting for most model scenarios during the first lockdown weeks. Also, you can clearly see a nice upward trend after the first couple of lockdown weeks - which is something that is tied with the effort by the business owner to do some additional sales.
What’s also interesting to see is that there seems to be organic growth in the restaurant sales between 2019 and 2020 - look how the January and February months of 2019 have lower sales than the same months in 2020. For simplicity sake, let’s look at this data aggregated by month and plot the months side by side to see the change:

The COVID-19 impact is even clearer when we look at the data with a monthly aggregation. Using March as an example, not only it wiped out the expected sales based on the same-period of 2019 (about 10 k euros) but it also cut every growth factor that would have been achieved if the trendline in January and February (between 30% and 50% more sales than same period in 2019!) had continued.
Building the Forecast
Now to the interesting part. Imagine we do a simple weekly sales forecast that expects the business to do the same sales as the same-period of the previous year (no growth factor).
Our forecast scenario with COVID-19 impact will be based on the following:
- mid-economic recovery;
- virus contained with only one lockdown period between weeks 11 and 21 - the actual scenario in Portugal, as of this writing;
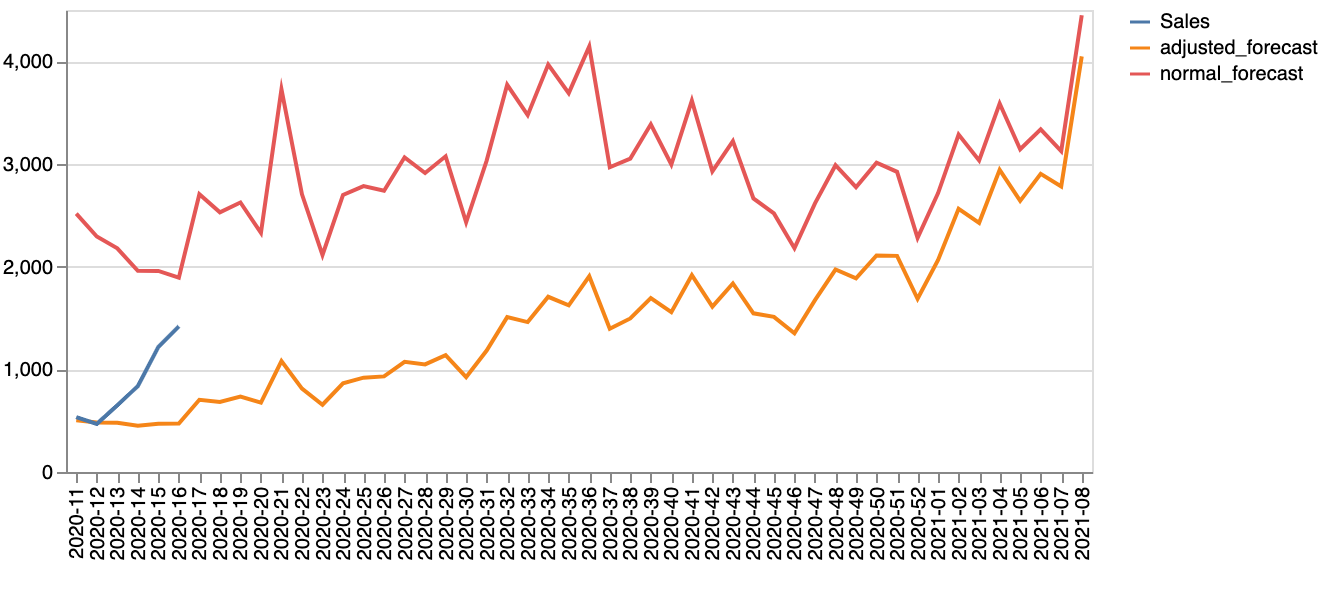
Notice how on the first two weeks (11 and 12 of 2020) the real sales (blue line) go hand-in-hand with the original forecast adjustment (yellow line).
The forecast seems… odd. We are failing to capture the whole recovery by the business and our produced orange line is way off the blue line - why is that?
Remember when we said that the restaurant was growing organically - between 30% and 50% YoY? We have to integrate that on our forecast!

Changing our forecast to integrate the growth factor gave us a better approximation. But one step is still missing - there was some information that we did not use on our forecast scenario - which was the ability of the business owner to adapt during the lockdown moment.
Adjustment of the model
The business owner now wants to be able to have a new adjusted forecast based on these new assumptions. He knows he will continue to push forward his marketing initiatives and knows that he will transfer part of his business to take-away as soon as lockdown is over. We can easily generate this forecast with the new information available:
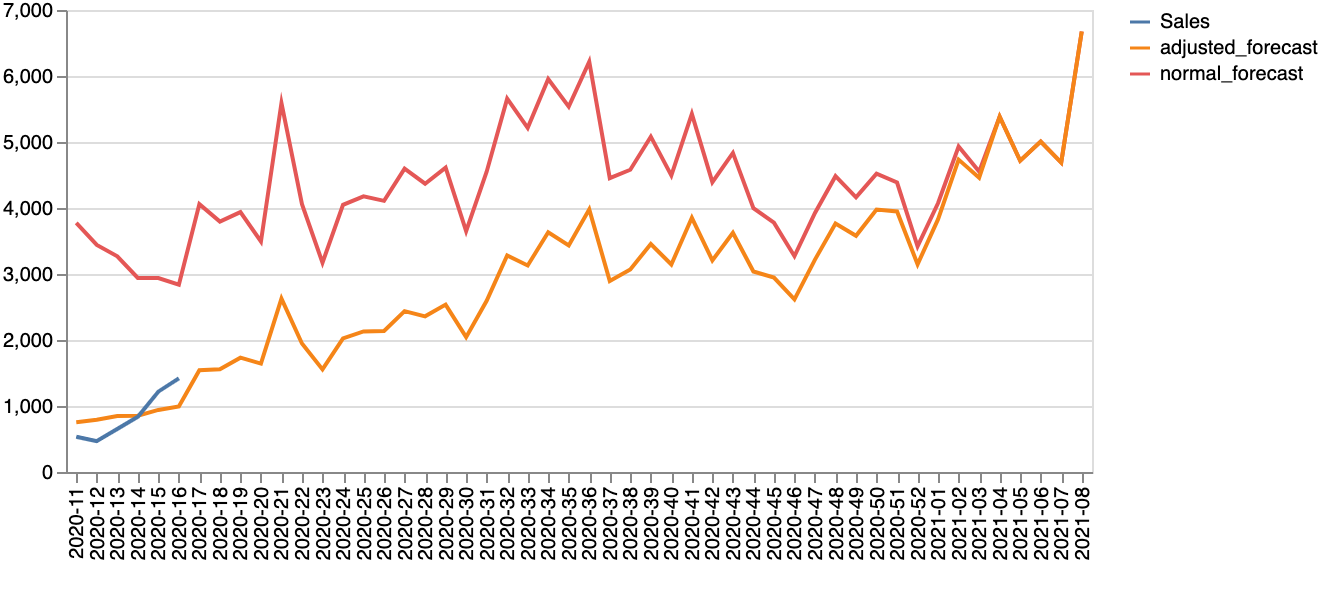
What did we just do? Changed the slope of lockdown growth (changed from growing 1 additional percentage point per week to 3) and that affected the entire forecast. Only one change in the parameters enabled the whole transformation of the forecast. Every week, we can update the model based on the new reality, producing better estimates for the weeks to come and being able to help the restaurant owner to make decisions based on data.
What’s interesting to notice, in terms of business, is that what changed the game after the thirteenth week was the proactivity of the business owner in scaling his business as a take-away restaurant (with a lot of marketing and social media involved), also adding high value products to cross-sell - such as bottles of wines and other alcoholic beverages. Most of the sales forecasts are dependent on these details - not only assessing the “new normal of demand” for products but also taking into account the changes that business owners will have to make to keep their business afloat.
And this is the main reason why we have kept the model fully updatable, not dependent on specific statistical scenarios and based on “what happened in the past, will happen in the future”. You can’t expect to use data from any other crisis to model this crisis in particular - sure, some things like supply and demand still stand but the overall uncertainty about society behaviour will introduce an error component that you just can’t manage with trained models. The best you should aim for is a range of approximations.
We based our model on heuristics that we can change as soon as new information is available - because this new information will be key to model the behaviour of the recovery slope. Again, no one knows what will happen with certainty during this crisis due to its unprecedented nature - the best we can do is construct forecasts with enough degrees of freedom that allow us to incorporate new information without relying on many mathematical assumptions that can be wrong.
Why we think this is a good approach - How can we collaborate
Due to the unprecedented times we are living in, models with pre-trained data might fail a lot of the times - and these models are more costly to change than a tweak-able forecast with some specific set of parameters. We want to be able to help businesses understand this new landscape and by looking at several types of sales data we will be able to gather a lot of intelligence of this “new normal”.
If you’d like to collaborate and receive a free report of your sales forecast with 3 expected recovery scenarios contact Sam in english at: sam@daredata.engineering or Nuno at nuno@daredata.engineering.