

DISCLAIMER
We are not economists. We are not epidemiologists. This is not an academic paper and has not gone through a peer review process. All core assumptions that are related to each of these fields are taken from experts. As a pandemic in modern times is a unique event, it is not possible to model resulting economic events with any degree of certainty. The best we can likely hope for is to get within an order of magnitude.
Any examples provided in this paper are NOT to be taken as ready for any particular use case. If you want to use the model, you need to do the hard work of selecting your parameters.
Expertise and Motivation
We are a boutique Data Science / Data Engineering consultancy who typically use Machine Learning to develop sales forecasts for our clients. As business owners we are concerned that many sales outlooks in the business community are more optimistic than they should be which could end up hampering long term economic growth. This blog post describes work that we have done to modify our long term sales forecasts that we have been delivering to our clients in an effort to inform strategic decision making and policy.
As experienced Data Scientists, our main contribution is the informed choice NOT to use data to train this model. Instead we use a rule-based, causal model that is entirely parameterized by the user. Machine Learning doesn’t work when there’s no historical data.
Call for help
We also need help to continue working on it. We need economists to review it and people to share their sales data so that we can start to paint a more realistic picture rather than just propose a framework. If you are interested and able to collaborate with us on this, please email me in English at: sam@daredata.engineering or Ivo in Portuguese at: ivo@daredata.engineering.
Core Assumptions
Most of our assumptions about local government responses and COVID-19 epidemic characteristics are taken from this article in the Economist which in turn relies largely on work done by epidemiologists at the Imperial College of London. Relevant to the shape of economic recoveries are the “timeboxing” and economic impact concepts developed by McKinsey. The most relevant assumptions are:
- The crisis will continue until we have reached herd immunity or a vaccine is widely administered.
- It will take between 1 and 2 years for a vaccine to be widely administered.
- There may be several lockdowns or other forms of social distancing until a vaccine is widely administered.
The other core assumption is that this model is most useful for suppliers of affected industries. This model was developed from the perspective of a supplier to the HORECA (hotel, restaurant, catering) industry. So when we refer to “clients” we are talking about businesses that would purchase from a supplier, NOT the civilian consumers. It is possible that this model may be applied to other industries but, as of this time, we do not feel comfortable explicitly recommending it. We will leave it up to the reader to decide if these model attributes are appropriate for their situation. We will continue to work with any industry experts available to understand which industries this may apply to.
Quick visual
Now into the details
According to epidemiologists, it is very possible that the current local outbreaks may last for several more months and we will be living with some sort of social distancing until there is a vaccine available. Even if epidemics subside in particular geographies, it may not be possible to return to business as usual until a vaccine is available due to the uncertain nature of potential flare-ups.
Being three weeks into the Portuguese lockdown (State of Emergency), most businesses have an idea of what the worst case scenario is for impact on their revenue and how governments / people have been reacting. We can attempt to combine this knowledge with that of epidemiologists to simulate what might happen to your revenue if your local epidemic continues for a year or more.
How are we doing this?
Here is a technical writeup of the model.
And here is a link to the open source implementation (still under active development).
We will use this post to describe the internals of the model while focusing on a few use cases. If you want to apply this to your data, we strongly recommend reading and understanding the writeup.
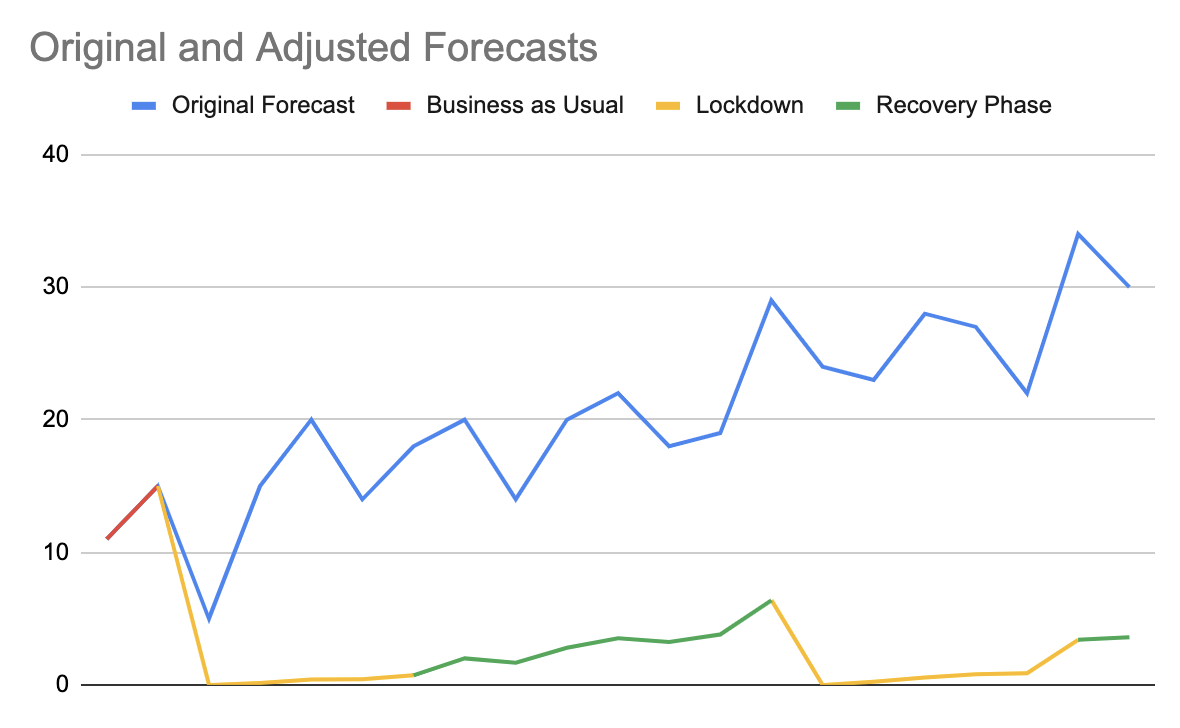
An example usage with example data looks like this:
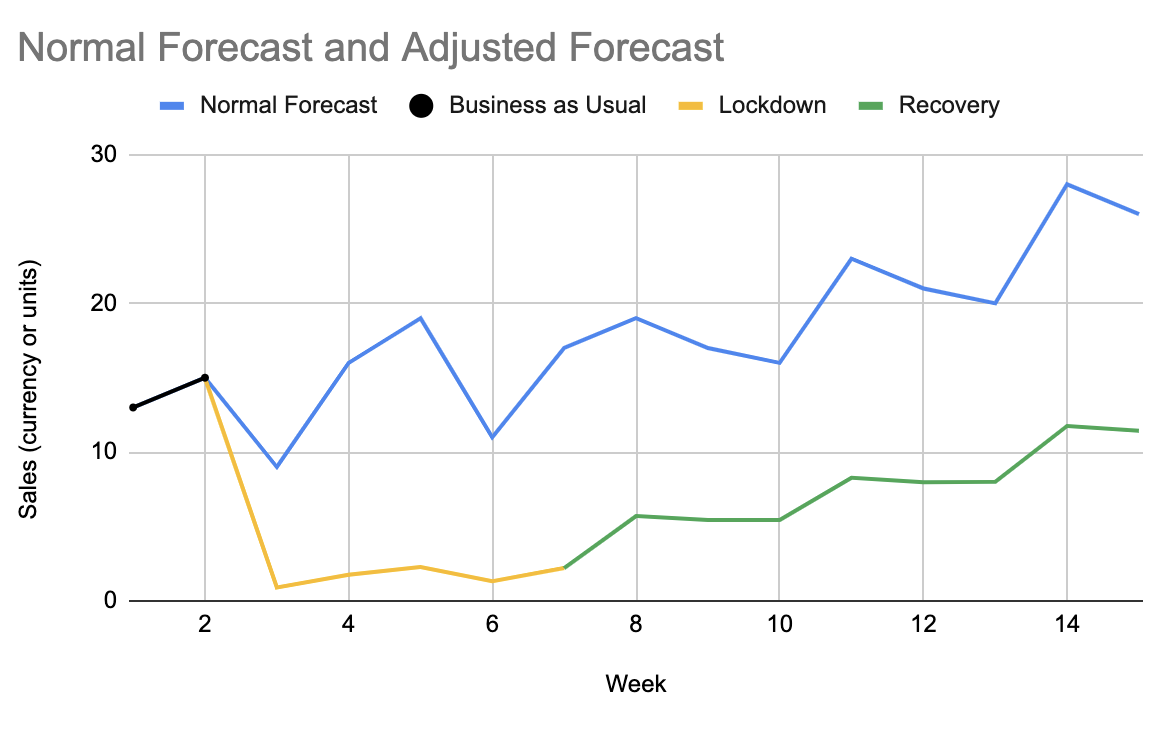
We model two main concepts: a lockdown and the following recovery. The rest of the article describes how to parameterize these phases.
Your Sales Forecast
The model uses a weekly sales forecast that was generated under the assumption that there is no crisis. Then it applies adjustments to the forecast using a set of rules that are supplied by the user of the model.
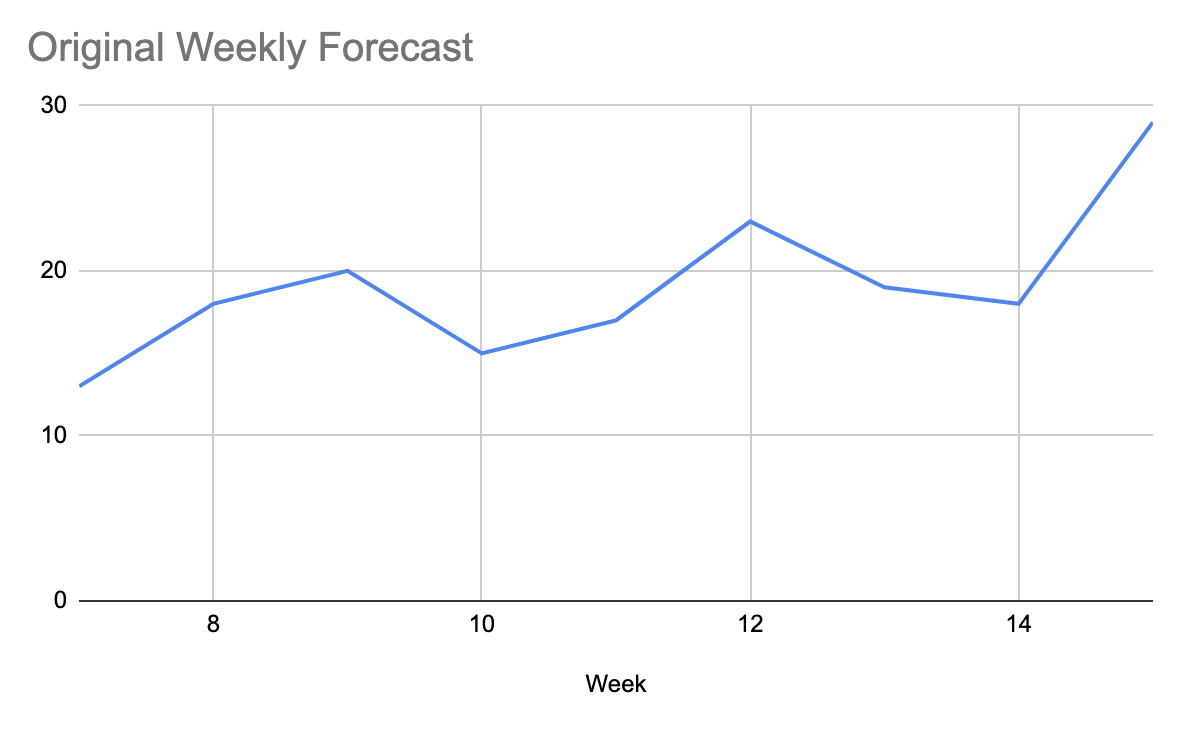
What this means is we need to start by defining a normal sales forecast. Let’s take a look at a typical sales forecast:
Lockdown Phase (a.k.a. State of Emergency)
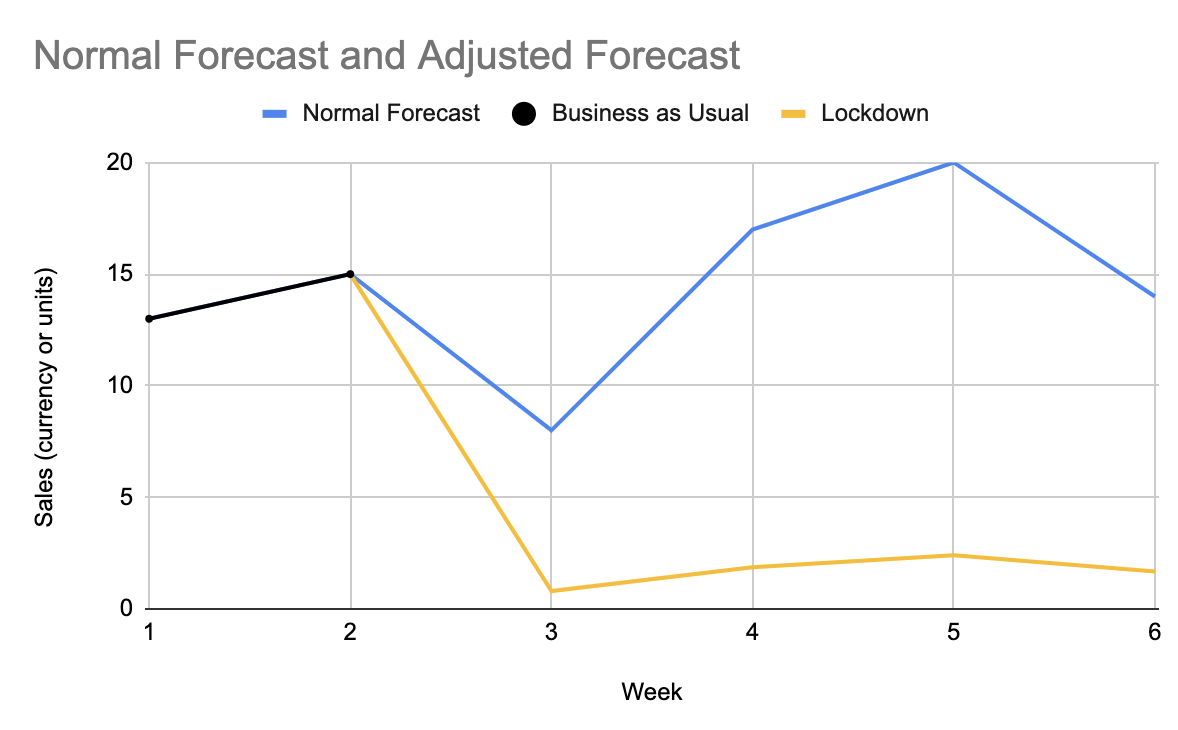
Here is what a transition from business as usual into a 4 week lockdown can look like in our model:
The actual length and severity of this phase depends on your local politics and culture more than anything else. Depending on all of these factors, you’ll need to select the following parameters.
- Lockdown length
- Initial revenue loss
- Client growth
- Client quit rate
Initial revenue loss
This is the value by which your revenue dropped in the first week of a lockdown. This is the only parameter of the model that most of us actually have.
Client growth rate
We have (in Portugal at the time of this writing) a few weeks of lockdown data. For example, I know of one restaurant whose revenue dropped to 10% of normal in the first week and they’ve managed to get a 5% bump in delivery and take-away which brought it up to 15%. This parameter is a function that you may implement however you’d like and our examples use a simple linear one.
Client quit rate
Businesses typically cannot withstand sustained periods of significant drops in revenue. Anecdotally, most small businesses have about 4 weeks of operating costs in cash and the subset of those which are restaurants have only 2 weeks. Given this, we assume that every week some portion of the restaurants will close their doors without a plan to reopen. Our examples use a simple linear function for this.
Recovery Phase
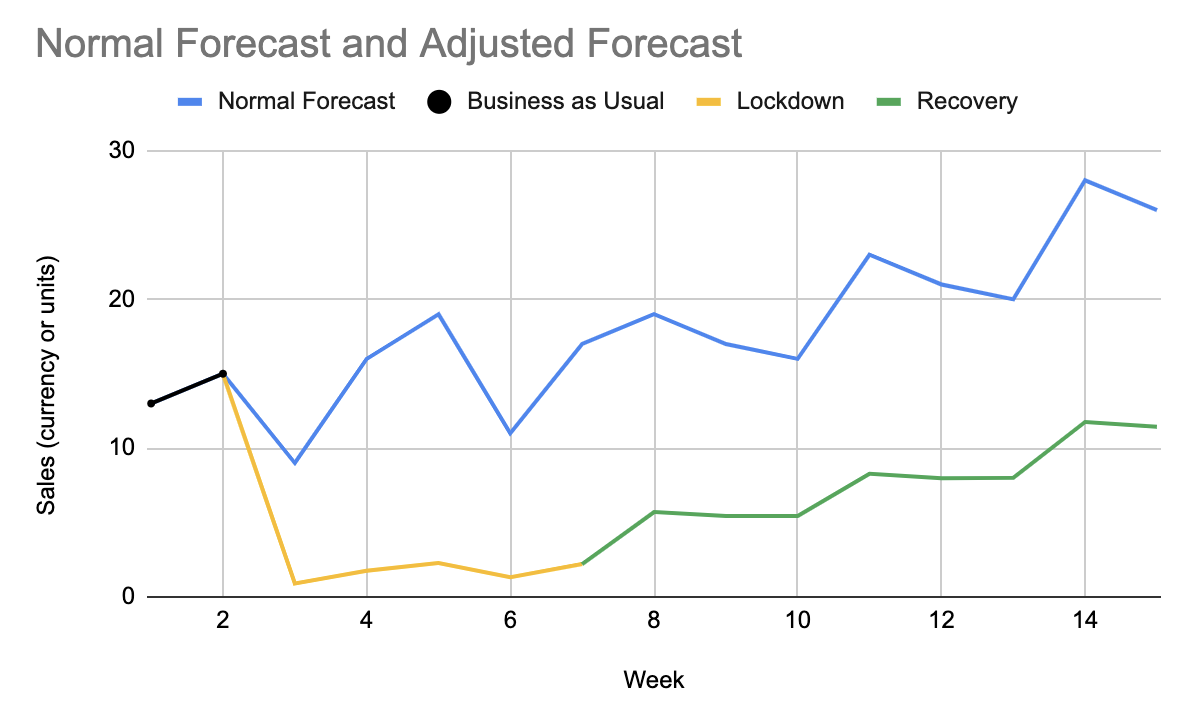
In this phase, the official lockdown has been lifted and you are now free to sell to anyone who will buy your offerings. In this example, it starts on week 8 which is why you see the sales jump:
The recovery phase is parameterized as follows:
Client Recovery
Some portion of the businesses that closed their doors will start to re-open or be replaced with others. This parameter is a function that expresses the rate at which they will open and in our examples is a simple linear function.
Market Appetite
The market will most likely not experience an immediate bounce back to normal. Your clients and the rest of the market may not regain confidence over time until a vaccine is widely available or herd immunity is reached.
Multiple Phases
There may be multiple lockdowns as people either are required to or voluntarily practice social distancing as a result of local outbreaks of the virus. An example in which there are two lockdowns might look like this:
Next Steps
As professional sales forecasters, we are very much interested to see how the current crisis affects the forecasts we’ve delivered to clients (other than the obviously disastrous short term results of course). In order to do this we need more sales datasets and more industry experts who know how their sector is reacting to the crisis.
If you’d like to collaborate on this with us contact me in English at: sam@daredata.engineering or Ivo in Portuguese at ivo@daredata.engineering.
In the meantime, stay well and stay at home if you’re job and personal life allows. We’ll get through this.