
The importance of having accurate sales forecasts
When we think of sales forecasting, a couple of interesting questions unfold:
- how do most businesses manage their operations without having an accurate view of the future?
- With strategic decisions having a long-term impact on business, are businesses using all the data they could?
Just like a driver can drive during a really foggy day with minimal lights on or an investor can invest in some asset without understanding the future parameters that will define his return, so can businesses manage their operations, human resources and sales without taking a glimpse into the future.
But I can almost hear what you are thinking - what do these situations have in common?
All three of them bring risk because you are acting with no clear view of the future!
- Without a clear view of the road ahead, the driver will probably steer the wheel too early or too late, hence increasing the risk of crashing.
- Without a clear view of the business environment ahead, the investor will more likely sell his investment too soon or too late, hence increasing the risk of incurring a loss.
- Without a clear view of the sales ahead, the business will be more likely affected by disruptions on its supply chain and supply/demand factors.
This constant dealing with uncertainty is something we all do in our every day business lives and we are in a constant struggle to achieve clearer vision of the future. What we attempt to do at DareData is use the latest tools to clarify this future.
For a retailer or a business that sells perishable or fast-moving consumer goods to other businesses thinking about the future becomes mandatory when you have to manage multiple stocks across multiple regions - your ability to avoid product expirations and manage shelf life of your products will be crucial in order to avoid overproducing or lower your margin at the end of the product validation date.
Also, enhancing your forecasts' accuracy enables you to allocate your commercial and logistic resources more efficiently - by knowing where to invest your marketing budget or even how many raw materials you should buy.
Most businesses - particularly retail ones - still rely on simple historical approximations to make their sales forecast. As the world moves on - and with the huge amount of data available / research on sales forecasting - companies that do not incorporate these new frameworks into their businesses are more prone to lag behind their competitors.
And you might be thinking - these businesses thrived for ages without using advanced forecasting models - and you are totally right, they thrived and will continue to survive. Retail is such a fast-paced industry that managing past and present data is per se an enormous task and retailers are experts in doing this - hence they can survive and thrive under short-to-medium term planning and thinking, but at a cost - lowering their prices or disposing their stocks.
And, to be honest, using simple forecasts based on past sales data is a reasonable and plausible approach to make plans for the coming years - but they fail to capture the full dynamics of demand for the companies products. There are so many external variables (such as weather) that might interfere with the supply/demand curve that only by using machine learning algorithms we are able to capture these effects.
And when you are in a global price-war with other competitors (the reality of some retailers) every cent you can save on your margin will be key to thrive in the coming years and a proper forecasting model will enable you to save money in the future.
In this post, I'll aim to explain how DareData approaches the usage of Machine Learning and Data Science to make forecasts and enable businesses to harness the power of prediction!
A real example from an actual client - Beverage Sales
One of our customers sells beverages - beverages with different flavours and different types that fulfil different customer needs.
Formerly, there was a process that generated sales for the coming year based on historical sales and this process was so important that most sales rep and warehouses depended on it - therefore the whole business depended on it.
The approach to a simple forecast (and what most companies do) is more or less based on this:
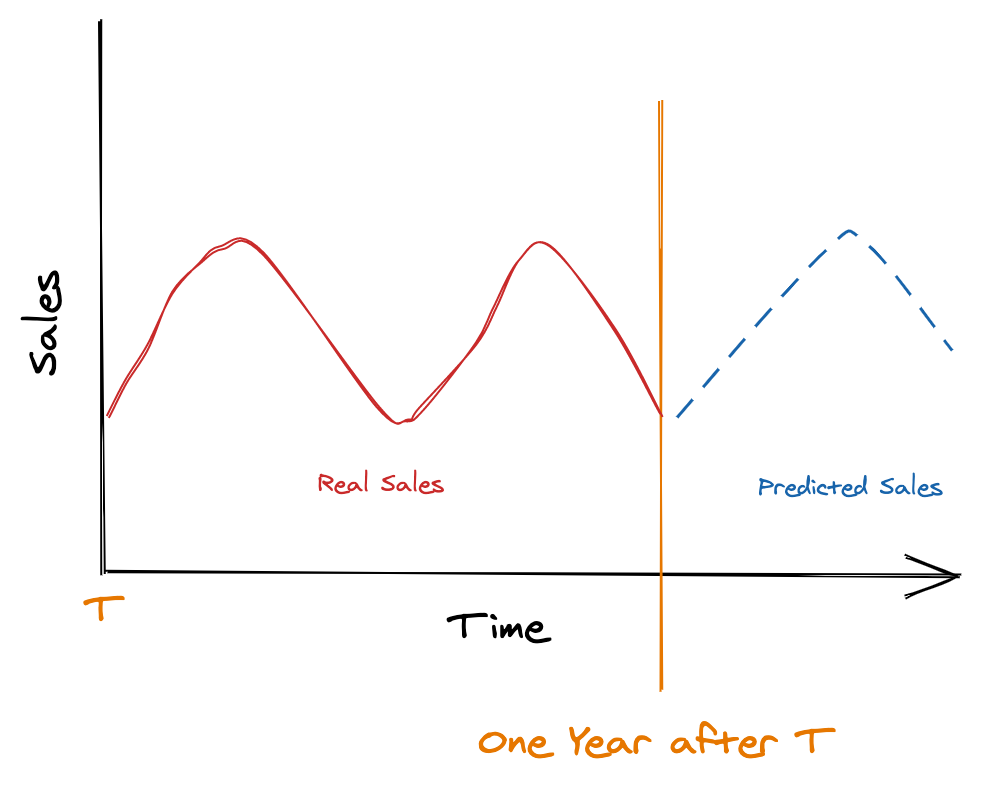
So, this means that most forecasts are done by just using simple approaches based on previous years - you can certainly apply some kind of growth factor but you end up with a similar time series to the one you had the previous year.
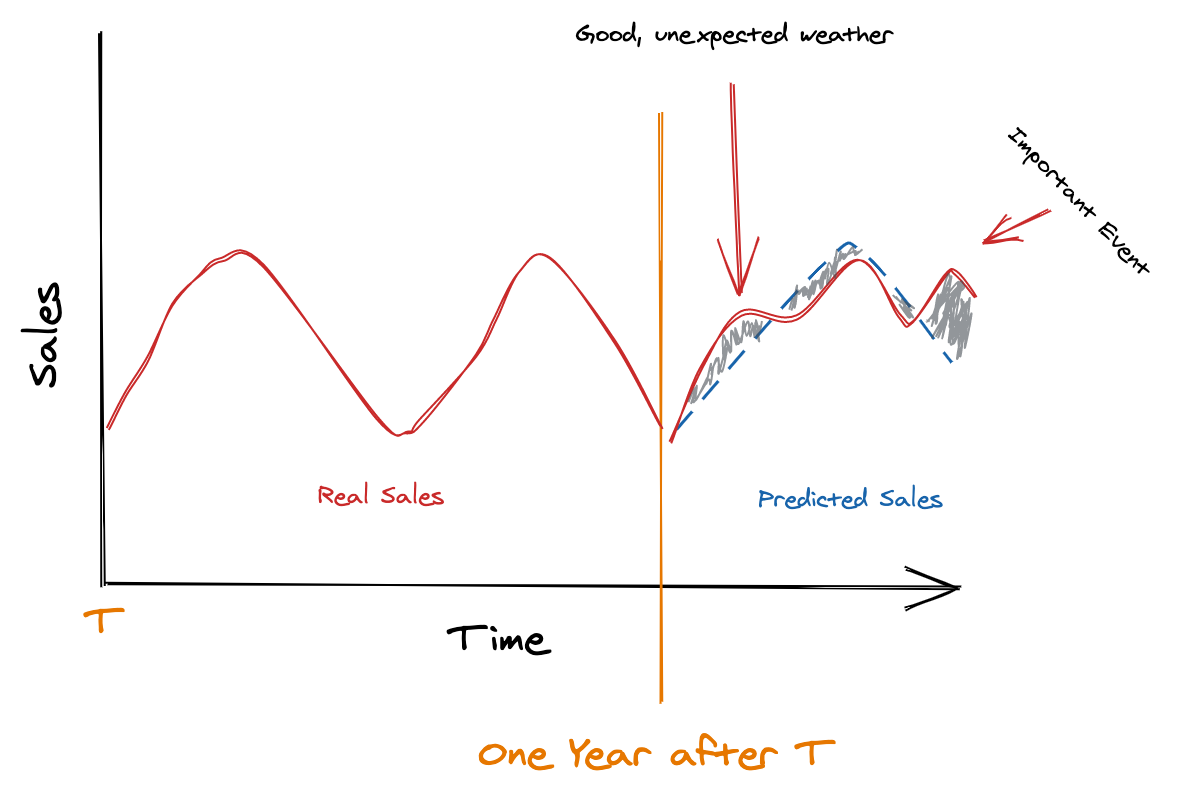
The thing is, many times, the real sales will deviate from your forecast, like this:
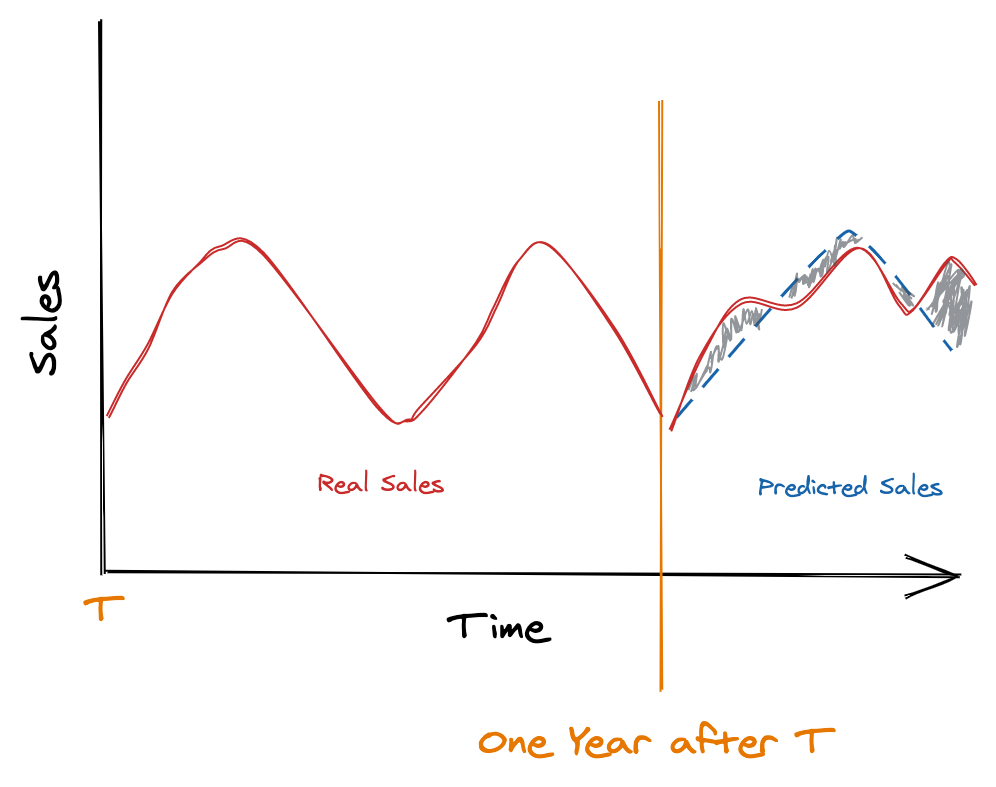
You probably think that this is not meaningful in terms of business - the predicted line seems to approximately follow real sales - the problem is, the grey shaded are (difference between real and prediction) probably means missed savings by the business:
- If your prediction falls below the real sales, you probably couldn't catch the full variation in demand - it is possible that customers were looking for your product but they found the shelves empty or businesses that sell your beverage without it.
- If your prediction above the sales, you probably sent too many of your products to retailers or restaurants and your product will be forgotten on the shelves (costing you money).
So, can you guess what might have happened here?
Real example (cont.) - Beverage Sales
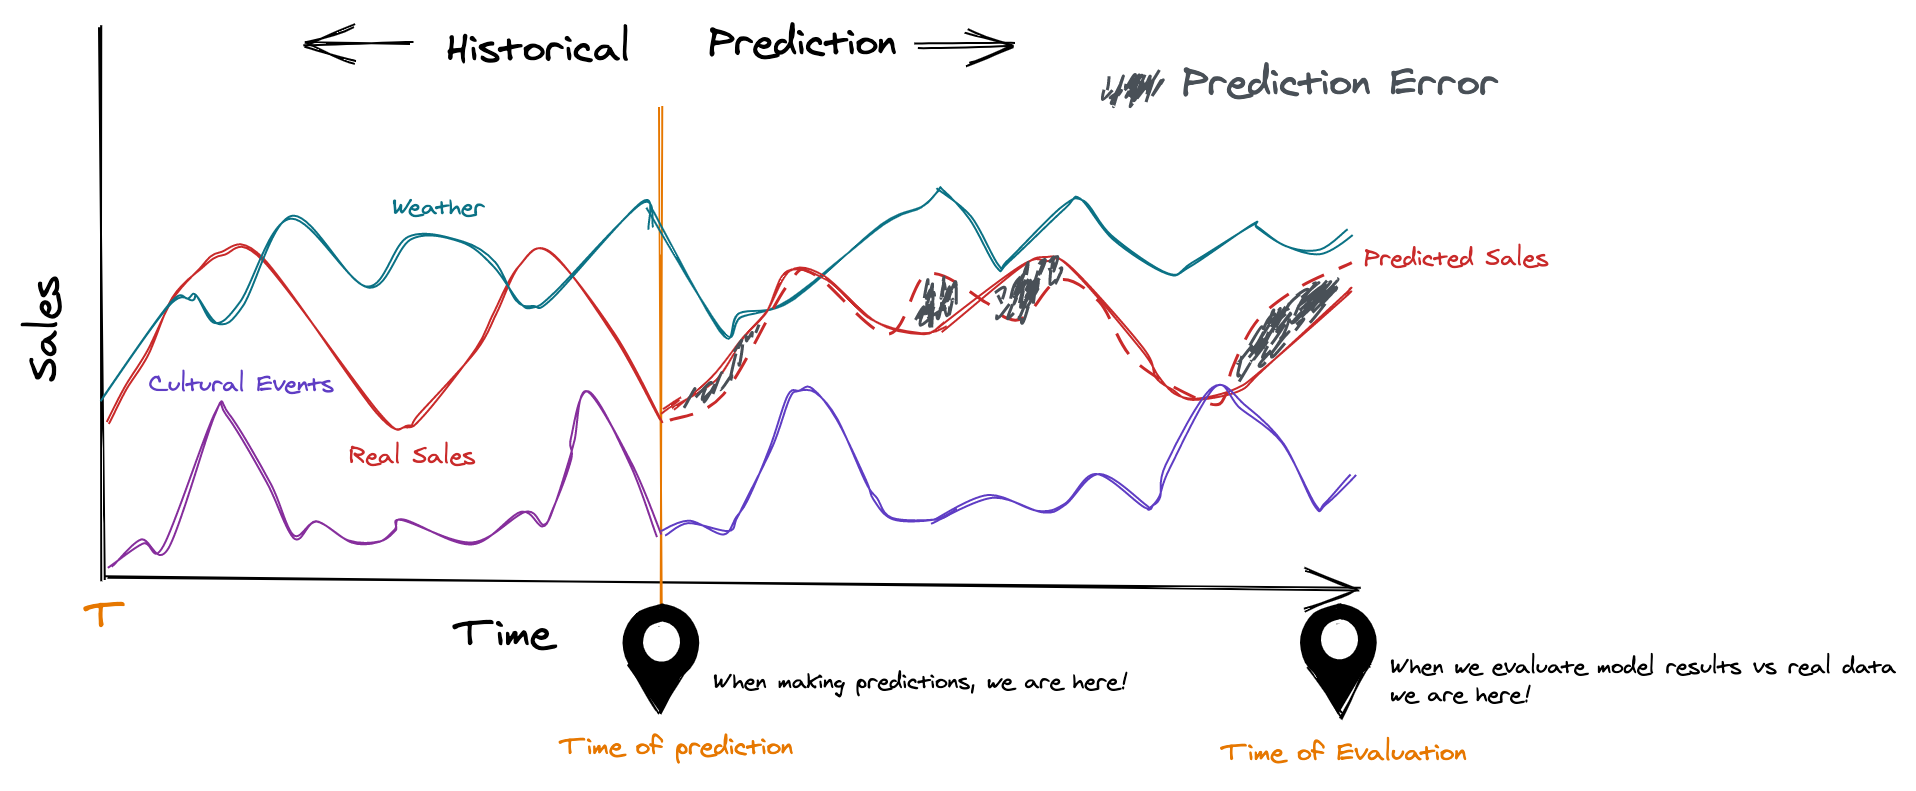
Let's take a closer look at our simulation above with new info we gathered:
A lot of times, you can't explain your sales only with your past sales data. It is absolutely crucial to incorporate external variables that are able to capture the fluctuation of the demand for your products. Now, it all boils down in solving three questions: "Who will buy my product, when and why?"
For our problem in particular, we can think of certain types of variables that might influence the behaviour of beverage sales - this is a process we call "feature discovery" where creativity is key and that is absolutely essential when developing algorithms. This is also one of the factors that sets the difference between a good and a great machine learning company - can you think of variables that might influence alcoholic and non-alcoholic beverage sales?
Let's take a look at some examples:
- Beverages are refreshing, so it's natural that some beverages sell more when the weather is hot. But some beverages (apart from hot ones) still sell a lot when the weather is cooler - such as vodkas and other kinds of spirit drinks.
- Type of beverage: different types of beverages have their own set of features that makes them prone to sell in certain conditions.
- Region: Let's take Portugal as an example. Portugal is a really small country in terms of land size - compared with other countries in Europe - but even so, regionalism is a strong characteristic of the country. Some beverages sell better on certain regions than others.
- Special events are also another possible feature that might influence the demand for beverages. Think of festivals, of sports events, of big national holidays or religious feasts (yes, really).
Now, you are probably thinking that this is a lot to think about. It would be almost impossible for a human to transform all this information into an accurate forecast - and this is where machine learning will help us!
Forecasting using Machine Learning
The key feature of every machine learning algorithm is the ability to infer the future based on past data - a pattern that we all tend to do when we make a decision on our daily lives. This is, clearly, what we want to do when we want to forecast future sales - learn from past data that can explain past sales so we can accurately forecast our future sales.
Given this, how exactly are we going to approach the usage of different variables in a forecasting model? And how are we going to measure the quality of our forecast?
At DareData, we use an iterative approach that consists of generating several models on different time horizons - simulating what a real life production model would do. Let's see an example:
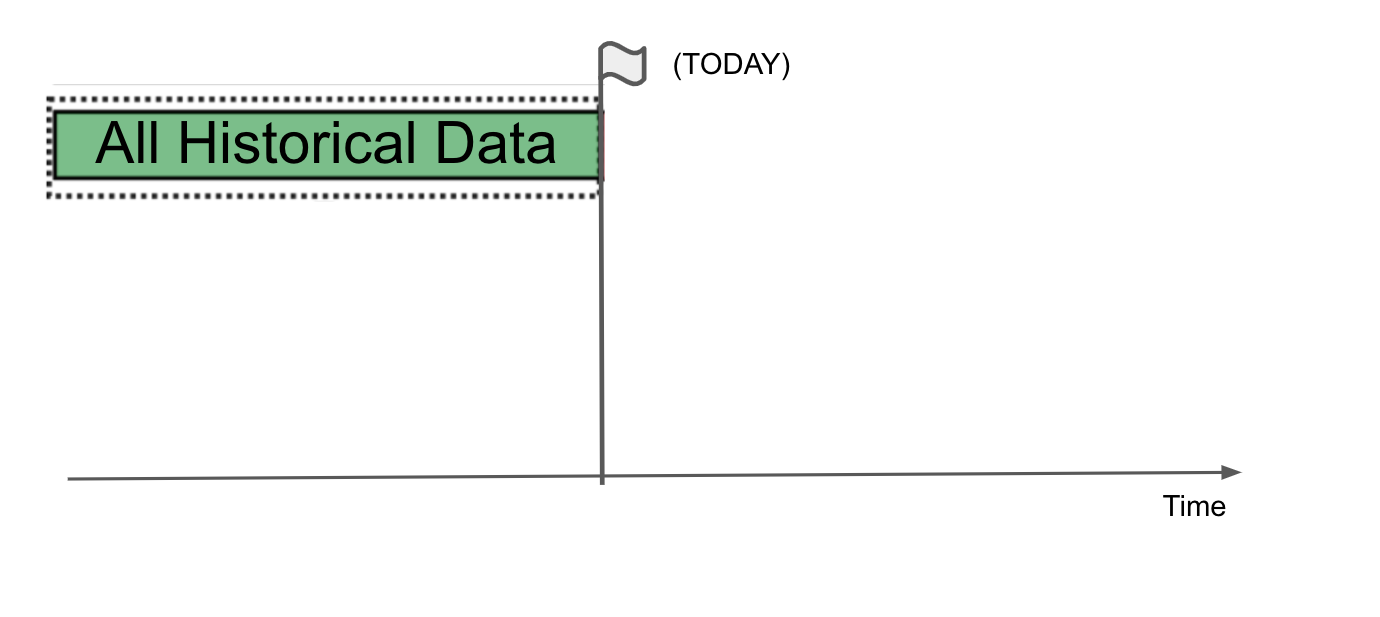
We could train our model with all this historical data (imagine that this "All Historical Data" are all the historical features we have talked about: past sales, holidays, weather data, etc.) and we try to predict sales from point Today.
You trained your model and you predicted future sales with an accuracy of 80%. Is this good? Is this bad? Let's see:
We would still like to improve our model accuracy and lower our prediction error. Is it possible to do this?
Positioning ourselves at our Time of Evaluation mark we compare the model results with the real world. You are pretty happy with your 80% accuracy but notice how the model seems to have different error rates at different times. The questions unfolds, "could you avoid the huge differences that you have in different periods"?
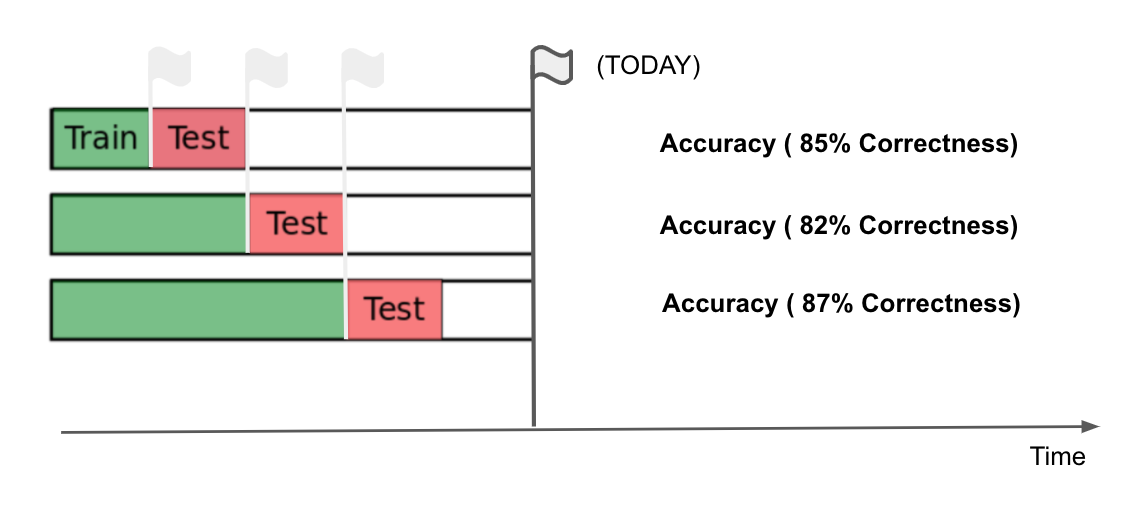
Yes! And we do it by training on chunks of data, incrementally:
But, the accuracy is not the only metric that should be evaluated here. If we are creating different models, can you think of another metric that would be good to evaluate the stability of the models performance?
Standard deviation! To ensure the stability of our models we want a high accuracy and low standard deviation:
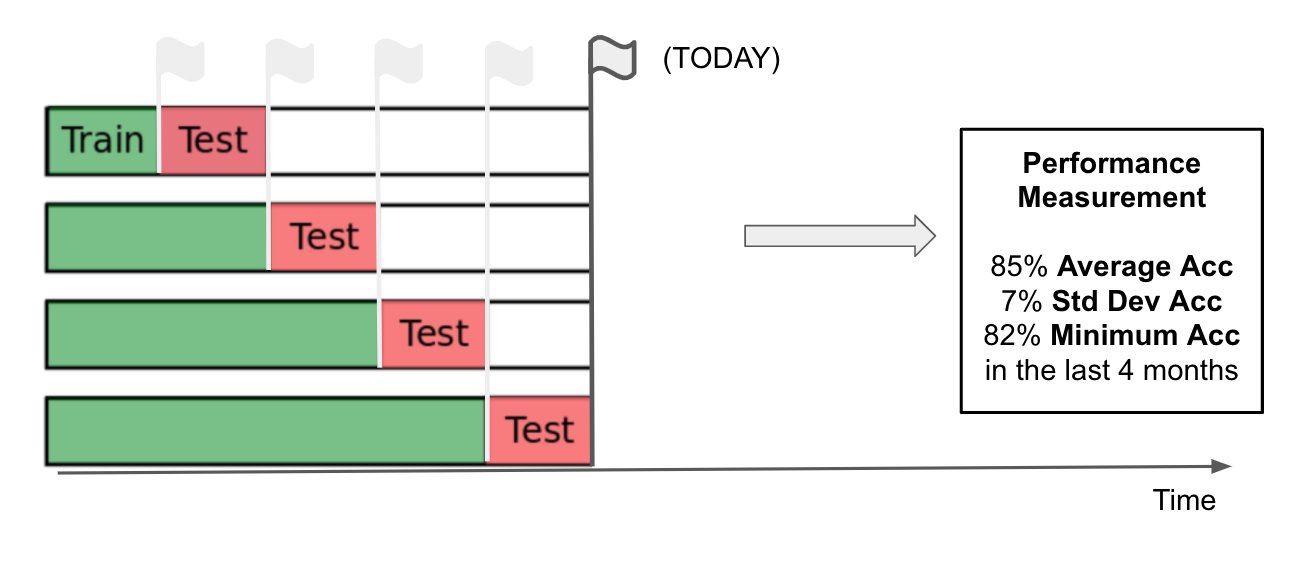
So the standard deviation of our accuracy (i.e. the variation of performance of our different models) tells us how much we should expect our model accuracy to change from iteration to iteration. Stability is one key factor in forecasting models - and ensuring stability is one of the key features that machine learning models should have when we are comparing with simple forecasts based on previous year sales. In the example above the "Test" set is data unseen by the model.
Now, for every change in the model that we do (every set of variables we add, for example), we develop our model with the following flow:
- Iteratively train our model with different time frames.
- Check model average and minimum accuracy and standard deviation.
- Select the set of models that maximize the accuracy and lower the standard deviation.
You are probably thinking.. "set of models?" ... yes! because the same can be done across different products, regions or dimensions as every product has its own set of variables that explain its sales:
- We can't compare beer to vodka or wine.
- And we definitely can't compare wine with diapers.
- And if we look only at wines, probably there are wines with different characteristics that will sell better across different regions.
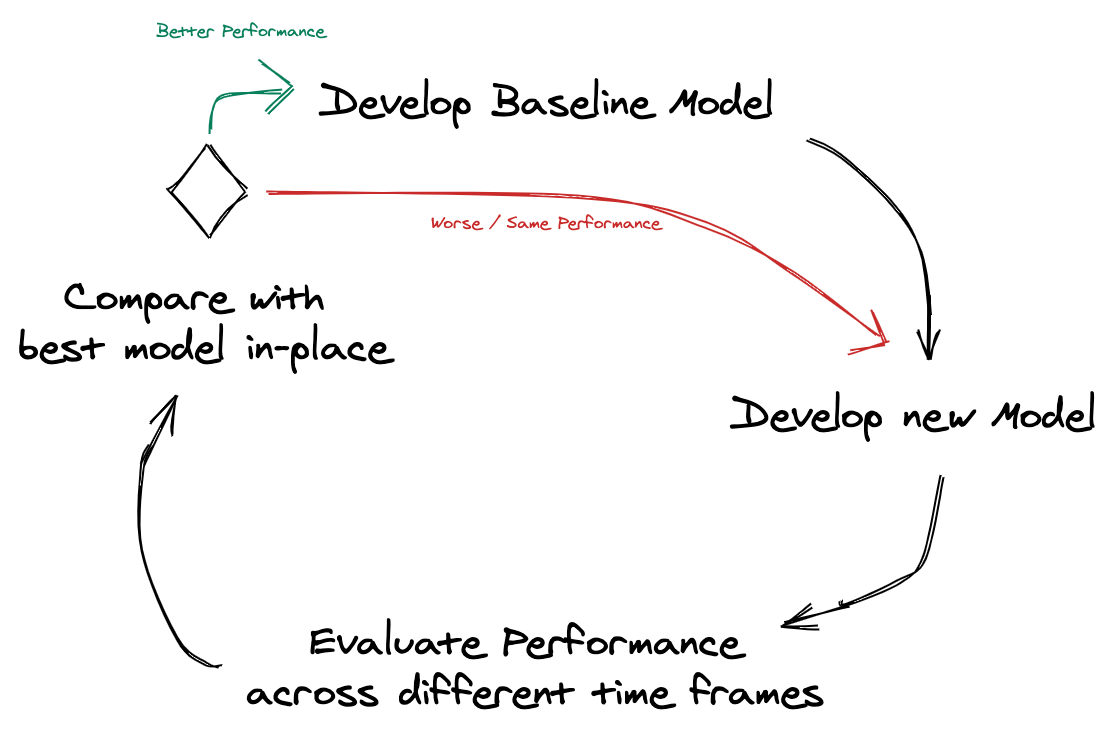
Forecasting Project
Here is our approach on developing Forecasting projects, starting at Develop Baseline Model:
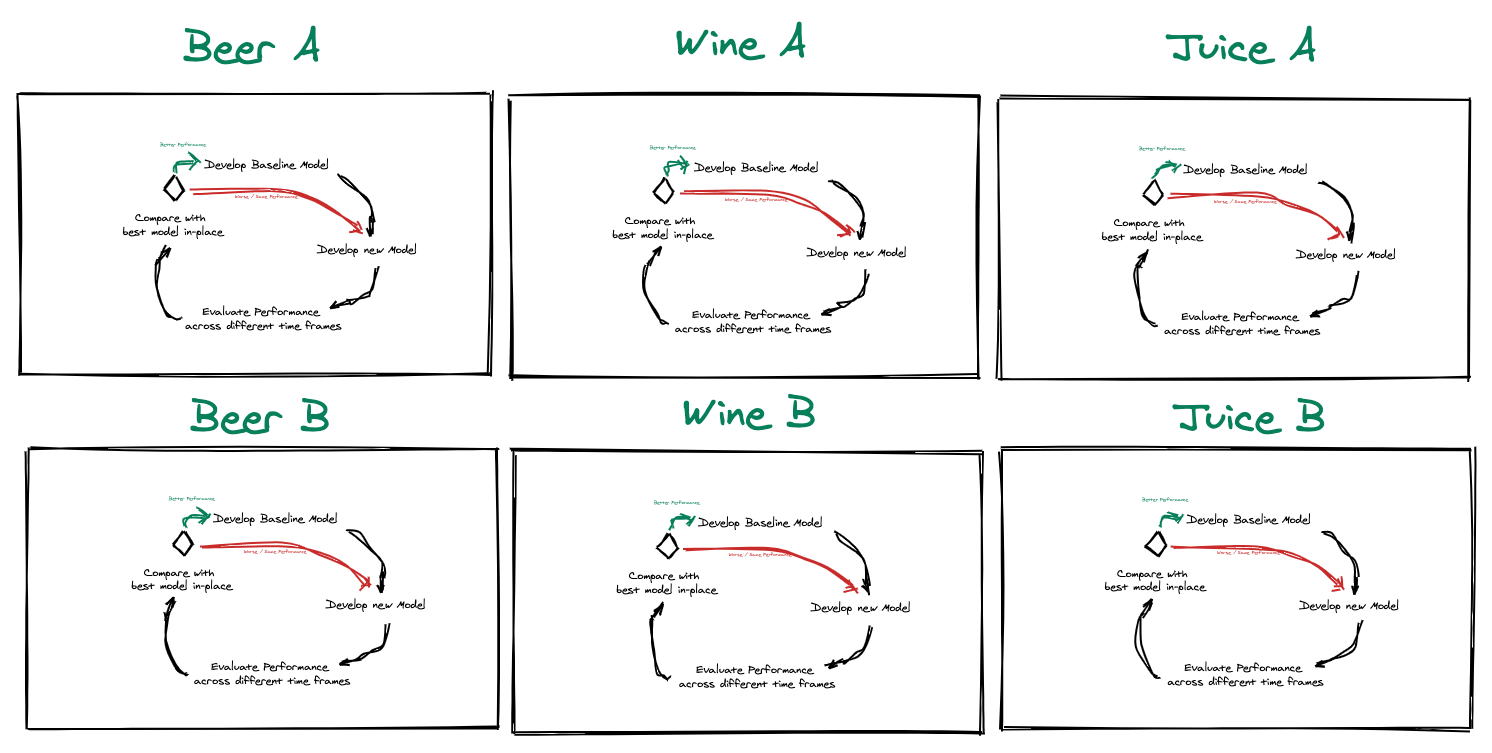
The interesting part is that we do this across different dimensions, like this:
Doesn't it look difficult to maintain all these models separately? If you have analysts manually adjusting them on a regular basis, then yes, it would be very expensive simply due to the man hours required. However, there is a reason we have 'Engineering' in our name: we are experts in automating Machine Learning processes to keep these costs down (why not take a look at our Practical path to AI blog post?) and we also believe there are also other positive benefits that may come when you develop a proper forecasting pipeline:
- The implementation of automatic forecasts forces you to develop and maintain a good data pipeline. Due to the fast-changing characteristic of the retail industry sometimes these types of projects are always delayed or left in backlog.
- You will throughly understand your business and the drivers that influence your customers - probably you know what most of them are but a good forecasting pipeline might help you uncover some new ones.
We usually start our project with a POC (proof of concept) of one or two products - this enables the company to test and evaluate the results before applying the forecasting algorithms on multiple dimensions (products / regions / etc.). It is also possible (and probably, advisable) to introduce forecasts slowly into the company's daily operations as a lot of stakeholders and employers depend on them - the success of a forecasting project is directly measured by its usage across the organization processes.
Conclusion
We believe our forecasting abilities have helped some of our FMCG and Retail clients to save a lot of money on inefficiencies in their supply chain and/or commercial activity. We believe every product has a story and with the fast-moving world we have today, the ability to forecast accurately is key to avoid product under or over production.
If you believe that you need someone to help you with:
- Understanding the variables that impact your sales.
- Managing your data infrastructure to make more accurate predictions.
- Developing an analytics strategy regarding your sales data.
Feel free to contact us at: sam@daredata.engineering
Thank you for taking the time to read this long post!