

In today's data-driven world, machine learning has emerged as a transformative force, empowering organizations to extract valuable insights from vast amounts of data. As the scope of the models and the data continues to scale, the role of a Data Scientist has evolved accordingly in the last years. Nowadays, the next step for a Junior Data Scientist to get into real-life projects resides in understanding how to gather, manage and organize information on different high-performing machine learning models; deploy them into production; and monitor the performance. These practices and methodologies are commonly known as MLOps, short for Machine Learning Operations and they bridge the gap between data science and software engineering, ensuring the pillars of experimentation: reproducibility, performance, scalability and monitorization. These pillars continue to thrive under traditional software engineering frameworks.
But that is not all! It further enables better collaboration and enhances the overall efficiency and effectiveness of Data Science teams, helping them leave the “Notebook” limbo[1]! Of course, this blog only exposes techniques regarding the construction and maintenance of Machine Learning models, one should never forget the fundamental statistical pillars guiding ML usage –for example, see /dsbuildingblocks-correlationcausality/.
For these reasons, this blog is intended to be an educational introduction to the main ideas behind MLOps, while providing examples of implementation - let’s start!
Experiment tracking
The first set of MLOps techniques revolves around model exploration. Tracking experiments, model management, and model registry facilitate reproducibility, collaboration, and efficient model lifecycle management. To illustrate these techniques, we can make use of the MLflow tool, while Amazon SageMaker, Azure Machine Learning, Neptune, and Weights & Biases present themselves as solid alternatives.
For example, take MLFlow, arguably, one of the most fundamental tools in MLOps - it provides a powerful experiment-tracking functionality that allows Data Scientists to record and organize experiments systematically. By logging the various metrics, parameters, and artifacts[2]–this is just a more general way of saying models and other useful objects– associated with each try, one can create a detailed record of the experimentation process. This enables reproducibility, as you can easily retrieve and reproduce past experiments by referencing their logged information, ensuring that scientific breakthroughs in your project are not lost. The power of this tool is more general than you may think: not only does it log the information we just mentioned, but every constructed model can be recorded with a .yaml file that specifies the package requirements to ensure reproducibility among Data Science teams and even in posterior deployment. Moreover, MLflow also has the capability of saving trained preprocessors, information about the validation and test datasets and much more! And all of these recordings can be saved either on the local machine, in a database locally or even in a server or cloud service, where one can then regulate and control access. This latter possibility allows for collaboration and knowledge sharing within Data Science teams. Multiple Data Scientists can work on the same project, view each other's experiments, and gain insights from previous trials. This fosters a collaborative environment and promotes the exchange of ideas and best practices.
Model registry
Even though MLflow does not have the ability to deploy models by itself, it can register models. This means that after our experiments are concluded and we have chosen a method, we can save this model in a special way. This registered model now can be given different versions, so we can update it and keep records on previous iterations of itself. Furthermore, with MLflow we can tag every registered model in three different categories: Staging, Production or Archived. This allows us to keep track of which model is in production and which one is pending to be deployed and even which previous models have now been discarded.
Know more about MLFlow’s Model Registry
Task Orchestration
As projects get bigger and bigger, the job of a data scientist starts requiring more knowledge about software development tools that help with the increasing number of tasks. A big step in quality and management can be achieved by finding a tool that aids in controlling and visualizing our code’s workflow. This is commonly referred to as task orchestration, automation and data workflow. We will use Prefect for the explanation, but feel free to explore other alternatives like the famous Apache Airflow, Dagster, Kestra… at DareData, we love Apache Airflow! In order to delve a bit deeper into this topic, we recommend Ivo’s take on this issue.
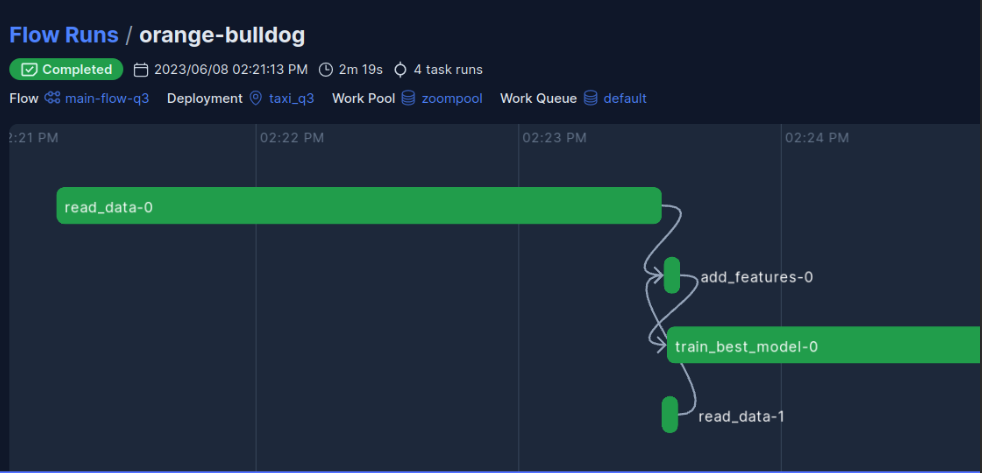
Prefect is a platform that provides a user interface to easily visualize, monitor, coordinate and schedule tasks. Another nice feature is that it also allows for alert notifications, for example, if something goes wrong or whenever a flow finishes successfully – for example, think about running a hyperparameter search for a model and having to deal with large datasets… these explorations may even take days, with orchestrators being able to manage hyperparameter search during the training process and even pass those best parameters to production seamlessly. Two nice features of Prefect:
- It is written in Python!
- It is able to run your code without the data living on Prefect servers, which provides a higher security level regarding data protection. So how does it work?
Returning to the task orchestration topic - there are two main components:
- Task: it is a Python function with a
@taskdecorator[3] that represents distinct pieces of work executed within a flow. - Flow: it is a Python function with a
@flowdecorator that represents the basic unit of a running piece. It can call tasks and other flows –named subflows.
Of course, all these decorators can be personalized: they can be given names, descriptions, specific names for each run, tags, etc. All of this allows for better tracking: knowing what task went wrong in which run and accessing its logs, understanding which tasks could be coordinated differently, for example running them simultaneously, etc. The objective of these building blocks is to have a neat way of coordinating by having visual control of how functions interact with each other. It even accommodates the use of markdown to build final reports for performances or other relevant information for the run.
Deployment
In case you want to keep the integration with the same tools, Prefect also allows us to control the workflow by modifying the deployment.yml and prefect.yml files to fit our needs. As discussed before, the nice thing about all of this is that Prefect does not run the processes in its servers, and can connect to Azure Blob Storage, AWS S3 buckets, GPC buckets, personal servers or other file systems and then run the tasks in a different computing service (this feature is also shared by Airflow 😉)
For general deployment and serving tools, however, there are more popular tools like Flask, Django or the Heroku service for deploying models during the development phase and creating API endpoints. For more sophisticated and scalable methodologies to use in production, we find that uvicorn, FastAPI or cloud-based services like Amazon SageMaker, Azure Machine Learning or Google AI Platform Prediction are more useful. Deployment is crucial because it translates models into actionable, real-world applications, driving business value and innovation. As such, there is not a one-size-fits-all flavour of deployment. Depending on what goals the model aims to achieve, we can find different ways of deploying a model:
- Batch Deployment: This method involves processing and scoring data in groups or batches, so we only run the model periodically. Data is collected over a period of time, and the model is run against this batch, all at once. Hence, this strategy is perfect for projects in which we do not need an immediate reply since instant answers imply higher costs. Some of the common use cases for this type are risk assessment in banking and other companies, retail inventory forecasting or healthcare patient segmentation.
- Streaming (or Real-time) Deployment: In this method, data is processed and scored as it is created, allowing immediate predictions. This is the approach to choose whenever instant replies are crucial. Think about Fraud Detection in Financial Transactions, so real-time predictions of each transaction to identify potential fraudulent activity; live traffic monitoring and predictions to account for accidents and punctual traffic congestion; real-time personalized advertising to dynamically select and display ads to users based on their immediate behaviour.
- On-demand Deployment: models are deployed as services. This means that they are just waiting and they produce predictions whenever they are called upon, often via an API. Think about chatGPT for example, it gives predictions (text) whenever users send their messages. This strategy is often used for chatbots, personalized recommendations on e-commerce sites, and diagnostic medical tools that provide instant analysis and results when medical staff input patient symptoms and medical data.
- Hybrid Deployment: at any stage, a combination of both might be a better answer. Think of personalized content recommendations where user behaviour data is processed in batches, but content suggestions are made in real time based on batch insights and real-time user actions.
Continuous Training & Data Drift
We know that in the modern world, everything changes… and fast! Even customer behaviour changes over periods of time and this means that your data might change its distribution, rendering your models outdated and decreasing their performance. This is an issue that can be solved in certain ways: from simple monitoring to full re-training automation. Since re-training is just about creating a workflow that automates the task, we will focus on data drift. For this task, there are a couple of providers: Evidently.ai, DeepChecks, and Fiddler AI, although full end-to-end solutions where everything is integrated make the procedure more user-friendly. These include Azure ML or AWS SageMaker.
Monitoring data distributions is a crucial part of building long-lasting predictive models while having control over shifts in the landscape. The level of monitoring goes from simply sending an email when things go a bit south, to re-train models whenever this happens. Especially when dealing with Neural Networks[4], where this retraining is kind of universal since we only need a couple of extra epochs with the new data for the network to adapt to these changes. In the meantime, this automated monitoring allows you to explore other models or to build apps that give you an x-ray of your current deployment, helping you be more transparent and win rapport with the business users.
Want to get your Data Science teams to the next level? Check out our wide variety of personalized training programmes at https://www.daredata.engineering/training or send me an email to roberto.alvarez@daredata.engineering describing your needs–even from a business perspective, you should really consider what MLOps has to offer –/better-tooling-more-money/.
Or are you a Junior Data Scientist who wants to get from Jupyter Notebooks or basic scripts to structured, clean, reusable code? Feel free to send me an email to roberto.alvarez@daredata.engineering. I would love to speak with you about these topics!
Know more about us on our website: https://www.daredata.engineering/
"Notebook limbo" is an informal term used in the data science community to describe the phase where data scientists work primarily within interactive computing environments, such as Jupyter Notebooks, for exploratory analysis and early model development. In this phase, while notebooks are excellent for experimentation, the work often lacks the robustness, version control, and scalability needed for production environments. The term "limbo" suggests a transitional state where the work is not yet ready to be transitioned into a more formal software development process with rigorous testing, deployment, and monitoring practices - key aspects of MLOps. The goal is to move beyond this limbo into a more structured and collaborative workflow that supports the entire machine learning lifecycle. ↩︎
An MLFlow artifact refers to any file or data that is outputted during a machine learning experiment. This could include models, data files, images, or other types of files that are associated with the training process. Artifacts are important for documenting the results of an experiment and are typically stored in a repository where they can be versioned, managed, and retrieved later. This enables data scientists to track changes over time, reproduce results, and collaborate with others by sharing their artifacts. In the context of MLFlow, artifacts provide a means to capture the full context of an experiment, ensuring that every element can be restored or analyzed in the future. ↩︎
A decorator in Python is a special function that can modify the behavior of another function or class. Think of it as a wrapper that adds some functionality or changes something about the function it's decorating without altering the function's code. It's denoted by the "@" symbol followed by the decorator's name before the function or class definition. Decorators are commonly used for tasks like logging, enforcing access control, modification of input or output, and more. They are a powerful feature for extending functionality in a clean and readable way. ↩︎
A neural network is a series of algorithms that endeavors to recognize underlying relationships in a set of data through a process that mimics the way the human brain operates. In essence, it is an adaptive system that learns by example. Neural networks are configured for specific applications, such as pattern recognition or data classification, through a learning process. They are composed of layers of interconnected nodes, or "neurons," which process input data and produce an output. The complexity and depth of these networks can vary greatly, with more layers and connections generally allowing for the capture of more intricate patterns in the data. ↩︎